

Preparation for IAS / State PSCs require among other things to be able to handle huge amounts of data in an interconnected way . Our notes employ a number of techniques to help you master these data optimally . We explain them here . But first , a quick word about how our brains process information.
Right Brain vs Left Brain
The concept of right brain and left brain thinking developed from the research in the 1960s of an American psychologist Roger Sperry. He discovered that the human brain has two very different ways of thinking.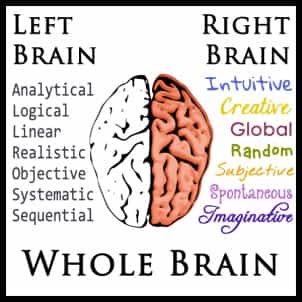 The right brain is visual and processes information in an intuitive and simultaneous way,looking first at the whole picture then the details. The left brain the other hand, is verbal and processes information in an analytical and sequential way, looking first at the pieces then putting them together to get the whole. Sperry was awarded Nobel Prize for his work in 1981.
So cutting to the chase , left brain thinking is verbal and analytical , whereas right brain is non-verbal and intuitive, using pictures rather than words.
By activating the power of both hemispheres, a person will be able to retain knowledge better and become proficient in any subject. All the techniques we have made use of in our notes underscore this basic idea of employing our right and left brains by using sequential information in diagrammatic ways . We explain the major techniques briefly here .
Mind Maps
Mind Map is a simple technique for drawing information in diagrams, instead of writing it in sentences. The diagrams always take the same basic format of a tree, with a single starting point in the middle that branches out, and divides again and again. The tree is made up of words or short sentences connected by lines. The lines that connect the words are part of the meaning.
To understand text, you have to read it. Reading is a two step process; first you interpret the sentences, then you create a mental image and hold it in your mind.
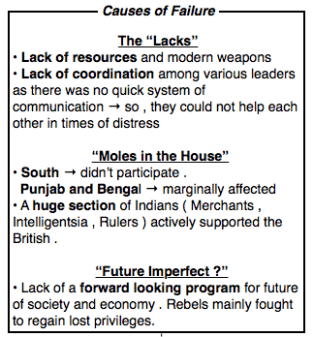
Eg. of Linear Text Notes
To understand a mind map, you can see it. A mind map directly represents the mental image that you would create from text ( For e.g. , the above text notes have been converted to a mind map below ). You can get to the meaning in one step, not two.
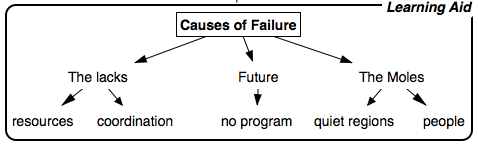
Mind Map of the Linear Text Notes above
We can easily focus on the parts that are important. The information is not flat and lifeless, but becomes interactive and worth exploring. It raises questions and makes us think. It starts to turn information into knowledge, insight and actions.
Trees reflect how our minds work, because we always seek patterns. Given two examples of something, most people will naturally think of a third, or will work out why there is no third. Trees encourage and capture this thought process efficiently and clearly.
Cloze Deletions and Graphic Deletions
Cloze deletion is a fancy term for a simple technique . It consists of a sentence with its parts missing and replaced by a blank dash or a question mark .The missing data is presented elsewhere.We have used it to help you remember factual data . When instead of going through the information directly , you have to answer a Question , you tend to involve your senses more by making more efforts and after a few repetitions will find the data stored in your long term memory .
Cloze deletion is easy and effective. It is a quick and effective method of converting textbook knowledge into knowledge that can be subject to learning based on spaced repetition.
A variation of this technique is graphic deletion where the missing data is on a diagram and has hints to recall the information :
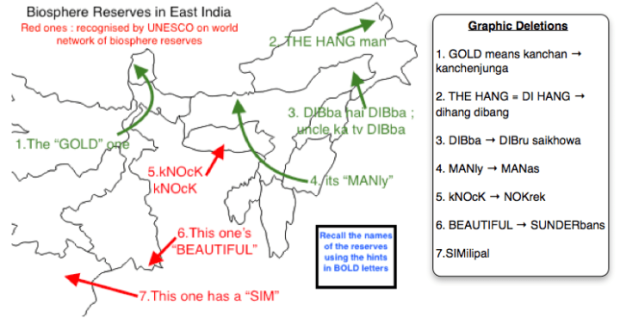
An e.g. of Graphic Deletion to remember Biosphere Reserves in East India
Imagery
Visual cortex is that part of the brain in which visual stimuli are interpreted. It has been very well developed in the course of evolution and that is why we say one picture is worth a thousand words.
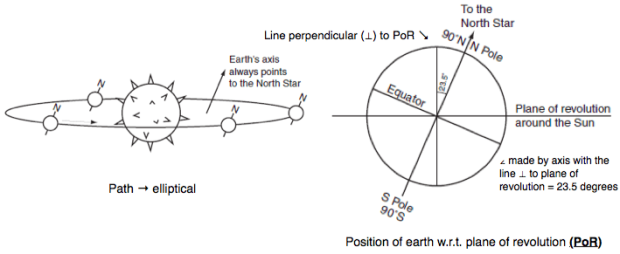
Example of use of Imagery in our notes
Indeed if you look at the number of details kept in a picture and the easiness with which your memory can retain them, you will notice that our verbal processing power is greatly inferior as compared with the visual processing power. The same refers to memory. A graphic representation of information is usually far less volatile.
Mnemonics
Mnemonic techniques are various techniques that make remembering easier.
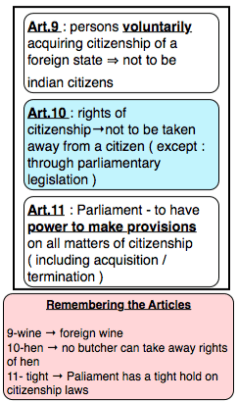
The red box uses mnemonics to remember the articles 9,10,11
They are often amazingly effective. They help learners recall larger pieces of information, especially in the form of lists like characteristics, steps, stages, parts, phases, etc. In 1967 Gerald R. Miller conducted studies to conclude that mnemonics increased recall. He found that students who regularly used mnemonic devices increased test scores up to 77%!
For example to remember the names and order of the major zones of the northern plains (Bhabhar , Tarai , Bhangar , Khadar ) , one will do well to remember the expression “BHaag Tilkha BHA-KH” with the capital letters standing for each zone .
It is generally self explanatory wherever we have used it in our notes . However , to use mnemonics to remember numbers as in diagram shown , you will need to remember a small mnemonics technique . Please refer the “How to use the notes” from menu or click here .
Outlines
An outline is a simple reorganisation of the information with branching done by indentation . We have used it only at some places and the following diagram illustrates its use in one of our notes :
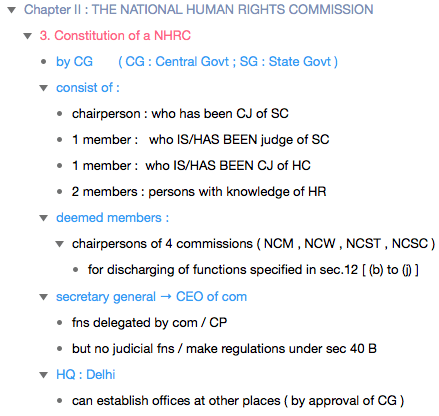
An ex. of an outline
80/20 Rule
This strategy utilizes the 80/20 rule also known as the Pareto Principle. The Pareto principle states that roughly 80% of effects come from 20% of the causes.This has to be taken with a pinch of salt though . The basic idea is that its a smaller part of the syllabus that accounts for larger score . Its more of a rule to organise your material giving importance to the more scoring areas first .We have used this in some of our notes . The following diagram illustrates the principle well :

The 80/20 rule
Thats it largely . Although we have used many more learning aids like tables , flowcharts , etc , they are pretty self explanatory as you go through the notes .
